Node 服务端渲染
VChart 提供了 Node 服务端渲染的能力,你可以在 Node 环境中使用 VChart 来生成图表图片,下面将向大家介绍如何使用 node-canvas 来实现图表的服务端渲染。
如何使用
VChart 的 Node 服务端渲染能力由底层的渲染引擎 VRender提供。使用方式很简单,下面通过一个简单的例子进行说明:
const fs = require('fs');

const VChart = require('@visactor/vchart');
const Canvas = require('canvas');

// 正常的图表 spec 配置
const spec = {
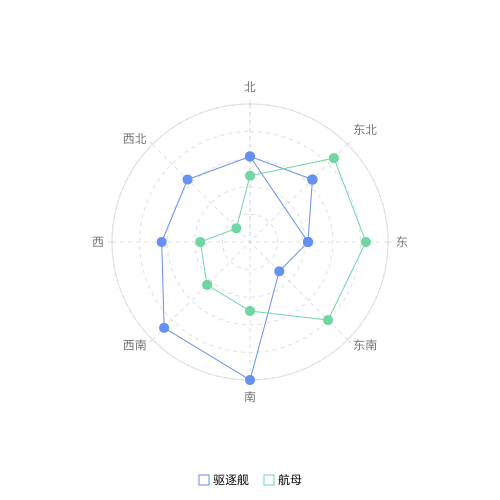
  type: 'radar',
  data: [
    {
      id: 'Map',
      values: [
        { key: 'North', value: 31, category: 'Destroyer' },
        { key: 'Northeast', value: 32, category: 'Destroyer' },
        { key: 'East', value: 21, category: 'Destroyer' },
        { key: 'Southeast', value: 15, category: 'Destroyer' },
        { key: 'South', value: 50, category: 'Destroyer' },
        { key: 'Southwest', value: 44, category: 'Destroyer' },
        { key: 'West', value: 32, category: 'Destroyer' },
        { key: 'Northwest', value: 32, category: 'Destroyer' },
        { key: 'North', value: 31, category: 'Destroyer' },
        { key: 'Northeast', value: 32, category: 'Destroyer' },
        { key: 'East', value: 21, category: 'Destroyer' },
        { key: 'Southeast', value: 40, category: 'aircraft carrier' },
        { key: 'South', value: 25, category: 'aircraft carrier' },
        { key: 'Southwest', value: 22, category: 'aircraft carrier' },
        { key: 'West', value: 18, category: 'aircraft carrier' },
        { key: 'Northwest', value: 7, category: 'aircraft carrier' },
        { key: 'North', value: 24, category: 'aircraft carrier' },
        { key: 'Northeast', value: 43, category: 'aircraft carrier' },
        { key: 'East', value: 42, category: 'aircraft carrier' }
      ]
    }
  ],
  categoryField: 'key',
  valueField: 'value',
  seriesField: 'category',
  legends: {
    visible: true,
    orient: 'bottom'
  }
};
const cs = new VChart.default(spec, {
  // 声明使用的渲染环境以及传染对应的渲染环境参数
  mode: 'node',
  modeParams: Canvas,
  animation: false // 关闭动画
});

cs.renderSync();

// 导出图片
const buffer = cs.getImageBuffer();
fs.writeFileSync(`./chart.png`, buffer);
执行上述脚本,你将会得到如下图片: