
简介
当我们有大量数据需要在图表上展示时,一般需要定义一个特定类型的系列(详见3.2节:series),在系列中创建图元来表示数据;然而,如果我们仅仅需要展示一点额外的信息,例如一张图片,一个标题,一条路径,而不想为之单独创建一个系列时,就可以用到自定义图元(customMark)。自定义图元可以让用户在图表上添加自定义的标记,比如添加一些文本、图片、线段等。
类型及示例
目前,所支持的自定义图元有如下几种类型:
-
symbol:点图形 -
rule:线段 -
text:文本 -
rect:矩形 -
path:路径 -
arc:扇区 -
polygon:多边形 -
group:组,可以将其他mark放到组下
如下例,在图表中除了两个数据点外(可以看作是一个scatter series), 在上方添加了三个自定义图元,分别为text, symbol, rule。
</div></div>
# 代码实现

自定义图元的代码入口:`packages/vchart/src/component/custom-mark`

1. 自定义图元的创建和管理

*  通过 `initMarks `方法,根据用户提供的配置`spec`创建自定义图元。

*  支持嵌套的图元结构(如`group`类型的图元可以包含子图元)。

```Typescript
  protected ***initMarks***() {
    if (!this._spec) {
      return;
    }
    const series = this._option && this._option.***getAllSeries***();
    const hasAnimation = this._option.animation !== false;
    const depend: IMark[] = [];

    if (series && series.length) {
      series.***forEach***(s => {
        const marks = s && s.***getMarksWithoutRoot***();

        if (marks && marks.length) {
          marks.***forEach***(mark => {
            depend.***push***(mark);
          });
        }
      });
    }
    // 设置组图元的父图元
    let parentMark: IGroupMark | null = null;
    if (this._spec.parent) {
      const mark = this.***getChart***()
        .***getAllMarks***()
        .***find***(m => m.***getUserId***() === this._spec.parent) as IGroupMark;
      if (mark.type === *'group'*) {
        parentMark = mark;
      }
    }
    // 递归调用的入口,递归地创建每一个图元
    this.***_createExtensionMark***(this._spec, parentMark, *`${PREFIX}_series_${this.id}_extensionMark`*, 0, {
      depend,
      hasAnimation
    });
  }
- 图元的样式和数据绑定
-
使用
_createExtensionMark方法为每个图元设置样式、动画配置和数据绑定。 -
支持通过
dataId或dataIndex绑定数据视图(DataView)。
  private ***_createExtensionMark***(
    spec: ICustomMarkSpec<Exclude<EnableMarkType, *'group'*>> | ICustomMarkGroupSpec,
    parentMark: null | IGroupMark,
    namePrefix: string,
    index: number = 0,
    options: { hasAnimation?: boolean; depend?: IMark[] }
  ) {
    // 创建图元
    const mark = this.***_createMark***(
      {
        type: spec.type,
        name: ***isValid***(spec.name) ? *`${spec.name}`* : *`${namePrefix}_${index}`*
      },
      {
        // 避免二次dataflow
        skipBeforeLayouted: true,
        attributeContext: this.***_getMarkAttributeContext***(),
        componentType: spec.componentType,
        key: spec.dataKey
      }
    ) as IGroupMark;
    if (!mark) {
      return;
    }
    if (***isValid***(spec.id)) {
      mark.***setUserId***(spec.id);
    }
    // 处理动画
    if (options.hasAnimation && spec.animation) {
      const config = ***animationConfig***({}, ***userAnimationConfig***(spec.type, spec as any, this._markAttributeContext));
      mark.***setAnimationConfig***(config);
    }
    // 构建组图元的层级结构
    if (options.depend && options.depend.length) {
      mark.***setDepend***(...options.depend);
    }
    if (***isNil***(parentMark)) {
      this._marks.***addMark***(mark);
    } else if (parentMark) {
      parentMark.***addMark***(mark);
    }
    // 设置样式
    this.***initMarkStyleWithSpec***(mark, spec);
    // 递归处理组图元
    if (spec.type === *'group'*) {
      namePrefix = *`${namePrefix}_${index}`*;
      spec.children?.***forEach***((s, i) => {
        this.***_createExtensionMark***(s as any, mark, namePrefix, i, options);
      });
    }
    // 处理数据绑定
    if (***isValid***(spec.dataId) || ***isValidNumber***(spec.dataIndex)) {
      const dataview = this.***getChart***().***getSeriesData***(spec.dataId, spec.dataIndex);
      if (dataview) {
        dataview.target.***addListener***(*'change'*, () => {
          mark.***getData***().***updateData***();
        });
        mark.***setDataView***(dataview);
      }
    }
  }
- 图元的上下文管理
- 提供
getMarkAttributeContext和_getMarkAttributeContext方法,定义图元的上下文信息(如全局映射、布局边界等)。
  protected _markAttributeContext: IModelMarkAttributeContext;
  ***getMarkAttributeContext***() {
    return this._markAttributeContext;
  }

  private ***_getMarkAttributeContext***() {
    return {
      vchart: this._option.globalInstance,
      chart: this.***getChart***(),
      ***globalScale***: (key: string, value: string | number) => {
        return this._option.globalScale.***getScale***(key)?.***scale***(value);
      },
      ***getLayoutBounds***: () => {
        const { x, y } = this.***getLayoutStartPoint***();
        const { width, height } = this.***getLayoutRect***();
        return new ***Bounds***().***set***(x, y, x + width, y + height);
      }
    };
  }
- 布局和边界计算
- 提供
getBoundsInRect和_getLayoutRect方法,用于计算图元的布局边界和尺寸。
  ***getBoundsInRect***(rect: ILayoutRect) {
    this.***setLayoutRect***(rect);

    const result = this.***_getLayoutRect***();
    const { x, y } = this.***getLayoutStartPoint***();
    return {
      x1: x,
      y1: y,
      x2: x + result.width,
      y2: y + result.height
    };
  }

  private ***_getLayoutRect***() {
    const bounds = new ***Bounds***();

    this.***getMarks***().***forEach***(mark => {
      const product = mark.***getProduct***();

      if (product) {
        bounds.***union***(product.***getBounds***());
      }
    });

    if (bounds.***empty***()) {
      return {
        width: 0,
        height: 0
      };
    }

    return {
      width: bounds.***width***(),
      height: bounds.***height***()
    };
  }
Mark的比较
CustomMark 与 BaseMark 的区别
1. 定义的层次
-
BaseMark: -
是一个基础类,直接定义了图元(
Mark)的行为和样式。 -
主要用于处理单个图元的样式、状态、属性计算等逻辑。
-
继承自
CompilableMark,提供_computeAttribute和_computeStateAttribute方法,将高层配置转换为底层渲染指令。与底层渲染引擎(如VGrammar)直接交互。 -
CustomMark: -
是一个组件类,负责管理多个图元的创建和行为。
-
继承自
BaseComponent,用于定义更高层次的自定义图元逻辑。 -
通过调用
BaseMark或其他图元类的方法,间接与底层渲染引擎交互。
2. 主要职责
-
BaseMark: -
负责单个图元的样式、状态和属性计算。
-
提供方法如
setStyle、getStyle、setAttribute等,用于操作单个图元的样式和属性。 -
直接处理图元的渐变色、边框、角度转换等细节。
-
CustomMark: -
负责管理多个图元的创建、样式设置和数据绑定。
-
提供方法如
initMarks和_createExtensionMark,用于根据配置动态创建图元。 -
处理图元的上下文信息(如全局映射、布局边界)和与其他组件的依赖关系。
3. 数据绑定
-
BaseMark: -
通过
setAttribute和_computeAttribute方法,直接绑定数据到单个图元的属性上。 -
支持通过映射(
scale)和字段(field)动态计算属性值。 -
CustomMark: -
通过
_createExtensionMark方法,为每个图元绑定数据视图(DataView)。 -
支持通过
dataId或dataIndex指定数据源。
4. 样式和动画
-
BaseMark: -
提供
_initStyle和_initSpecStyle方法,用于初始化单个图元的样式。 -
支持渐变色、边框、角度转换等样式的动态计算。
-
CustomMark: -
在
_createExtensionMark方法中,为每个图元设置样式和动画配置。 -
默认不为自定义图元添加动画,但支持用户通过配置启用动画。
CustomMark 与 ExtensionMark 的区别
1. 从定义上看
CustomMark配置项的接口如下:
export interface ICustomMarkSpec<T extends EnableMarkType>
  extends IModelSpec,
    IMarkSpec<IBuildinMarkSpec[T]>,
    IAnimationSpec<string, string> {
  type: T;
*  // mark对应的名称,主要用于事件过滤如: { markName: 'yourName' }*
  name?: string;
*  // 关联的数据索引*
  dataIndex?: number;
*  // dataKey用于绑定数据与Mark的关系,如果数据和系列数据一致,可以不配置,默认会读取系列中的配置*
  dataKey?: string | ((datum: any) => string);
*  // 关联的数据id*
  dataId?: StringOrNumber;
*  // 指定组件类型*
  componentType?: string;
*  // 是否开启动画*
  animation?: boolean;
*  // 指定 parent Id*
  parent?: string;
}
ExtensionMark配置项的接口如下:
export interface IExtensionMarkSpec<T extends Exclude<EnableMarkType, *'group'*>> extends ICustomMarkSpec<T> {
*  // 关联的数据索引*
  dataIndex?: number;
*  // dataKey用于绑定数据与Mark的关系,如果数据和系列数据一致,可以不配置,默认会读取系列中的配置*
  dataKey?: string | ((datum: any) => string);
*  // 关联的数据id*
  dataId?: StringOrNumber;
*  // 指定组件类型*
  componentType?: string;
}
可以看出:
ICustomMarkSpec是一个通用的接口,用于定义自定义的Mark(标记)。它继承了多个接口,包括IModelSpec、IMarkSpec和IAnimationSpec,并且支持所有的EnableMarkType类型。
export interface IExtensionMarkSpec<T extends Exclude<EnableMarkType, *'group'*>> extends ICustomMarkSpec<T> {...}
2. 从使用上看
-
extensionMark是图表支持用户在图表系列上补充绘制任意内容的自定义接口。 -
customMark可以让用户在图表上添加自定义的标记,比如添加一些文本、图片、线段等。
更具体的,当图表中包含多个series时,extensionMark的配置应当是放在series的配置当中的,属于对某个series的补充;而customMark是针对整个图表的,对图表信息的补充。二者所针对的对象和所在的层次不同。
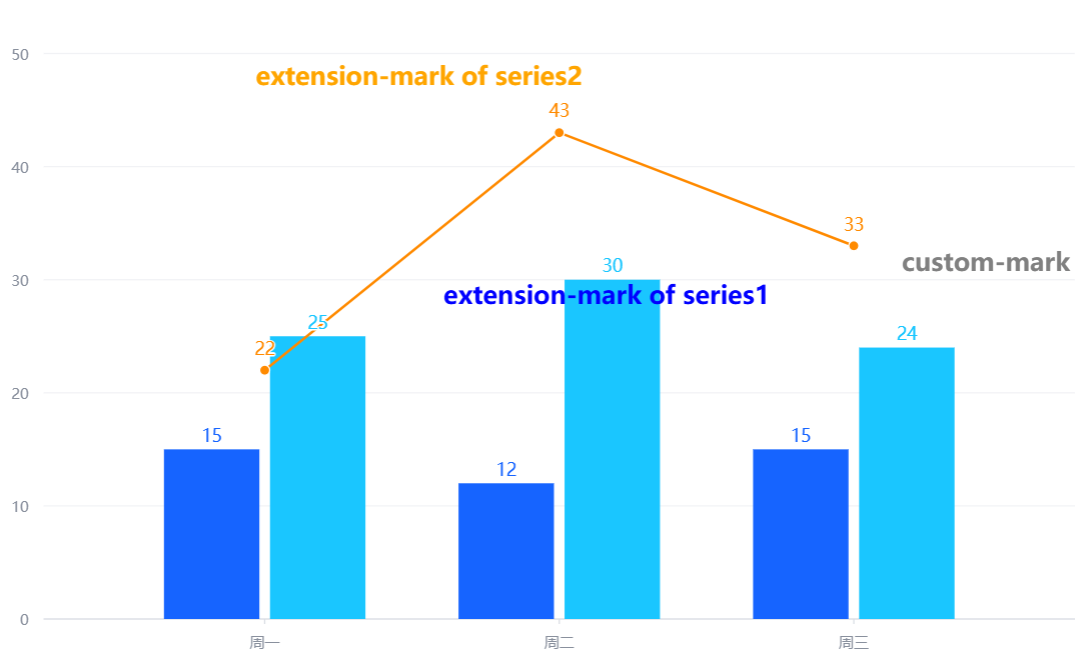
如下例,我们定义了两个series,并分别为它们添加了一个文本类型的extensionMark(紫色部分),这些extensionMark的配置是属于某个series配置中的;与此同时,我们在series配置之外,添加了一个文本类型的customMark(蓝色部分),它的配置是属于整个图标配置的。
const spec = {
  type: 'common',
  data: [
    {
      id: 'id0',
      values: [
        { x: '周一', type: '早餐', y: 15 },
        { x: '周一', type: '午餐', y: 25 },
        { x: '周二', type: '早餐', y: 12 },
        { x: '周二', type: '午餐', y: 30 },
        { x: '周三', type: '早餐', y: 15 },
        { x: '周三', type: '午餐', y: 24 }
      ]
    },
    {
      id: 'id1',
      values: [
        { x: '周一', type: '饮料', y: 22 },
        { x: '周二', type: '饮料', y: 43 },
        { x: '周三', type: '饮料', y: 33 }
      ]
    }
  ],
  series: [
    {
      type: 'bar',
      dataIndex: 0,
      label: { visible: true },
      seriesField: 'type',
      xField: ['x', 'type'],
      yField: 'y',
      extensionMark:[{
        type: 'text',
        style: {
          fontSize: 20,
          fontWeight: 600,
          text: "extension-mark of series1",
          x: 450,
          y: 200,
          fill: 'blue',
        }
      }]
    },
    {
      type: 'line',
      dataIndex: 1,
      label: { visible: true },
      seriesField: 'type',
      xField: 'x',
      yField: 'y',
      stack: false,
      extensionMark:[{
        type: 'text',
        style: {
          fontSize: 20,
          fontWeight: 600,
          text: "extension-mark of series2",
          x: 300,
          y: 25,
          fill: 'orange',
        }
      }]
    }
  ],
  customMark:[{
    type: 'text',
    style: {
      fontSize: 20,
      fontWeight: 600,
      text: "custom-mark",
      x: 800,
      y: 200,
      fill: 'grey',
    }
  }],
  axes: [{ orient: 'left' }, { orient: 'bottom', label: { visible: true }, type: 'band' }],
};

const vchart = new VChart(spec, { dom: CONTAINER_ID });
vchart.renderSync();
而如果把extensionMark和customMark的位置调换,都是不能被正确解析的。
比较小结
VChart中出现了多种和Mark有关的概念:
-
Mark:基础图元,不仅仅可以对数据进行可视化(系列中的图元), 而且还构成了图表中的各个组件; -
customMark:自定义图元,作为图表的组件,对图表信息进行补充说明; -
extensionMark:扩展图元,在系列当中,不仅有表示数据的各种主要图元,还可以添加补充说明该系列信息的扩展图元; -
markLine、markArea、markPoint:图表组件,同样对图表信息进行补充。