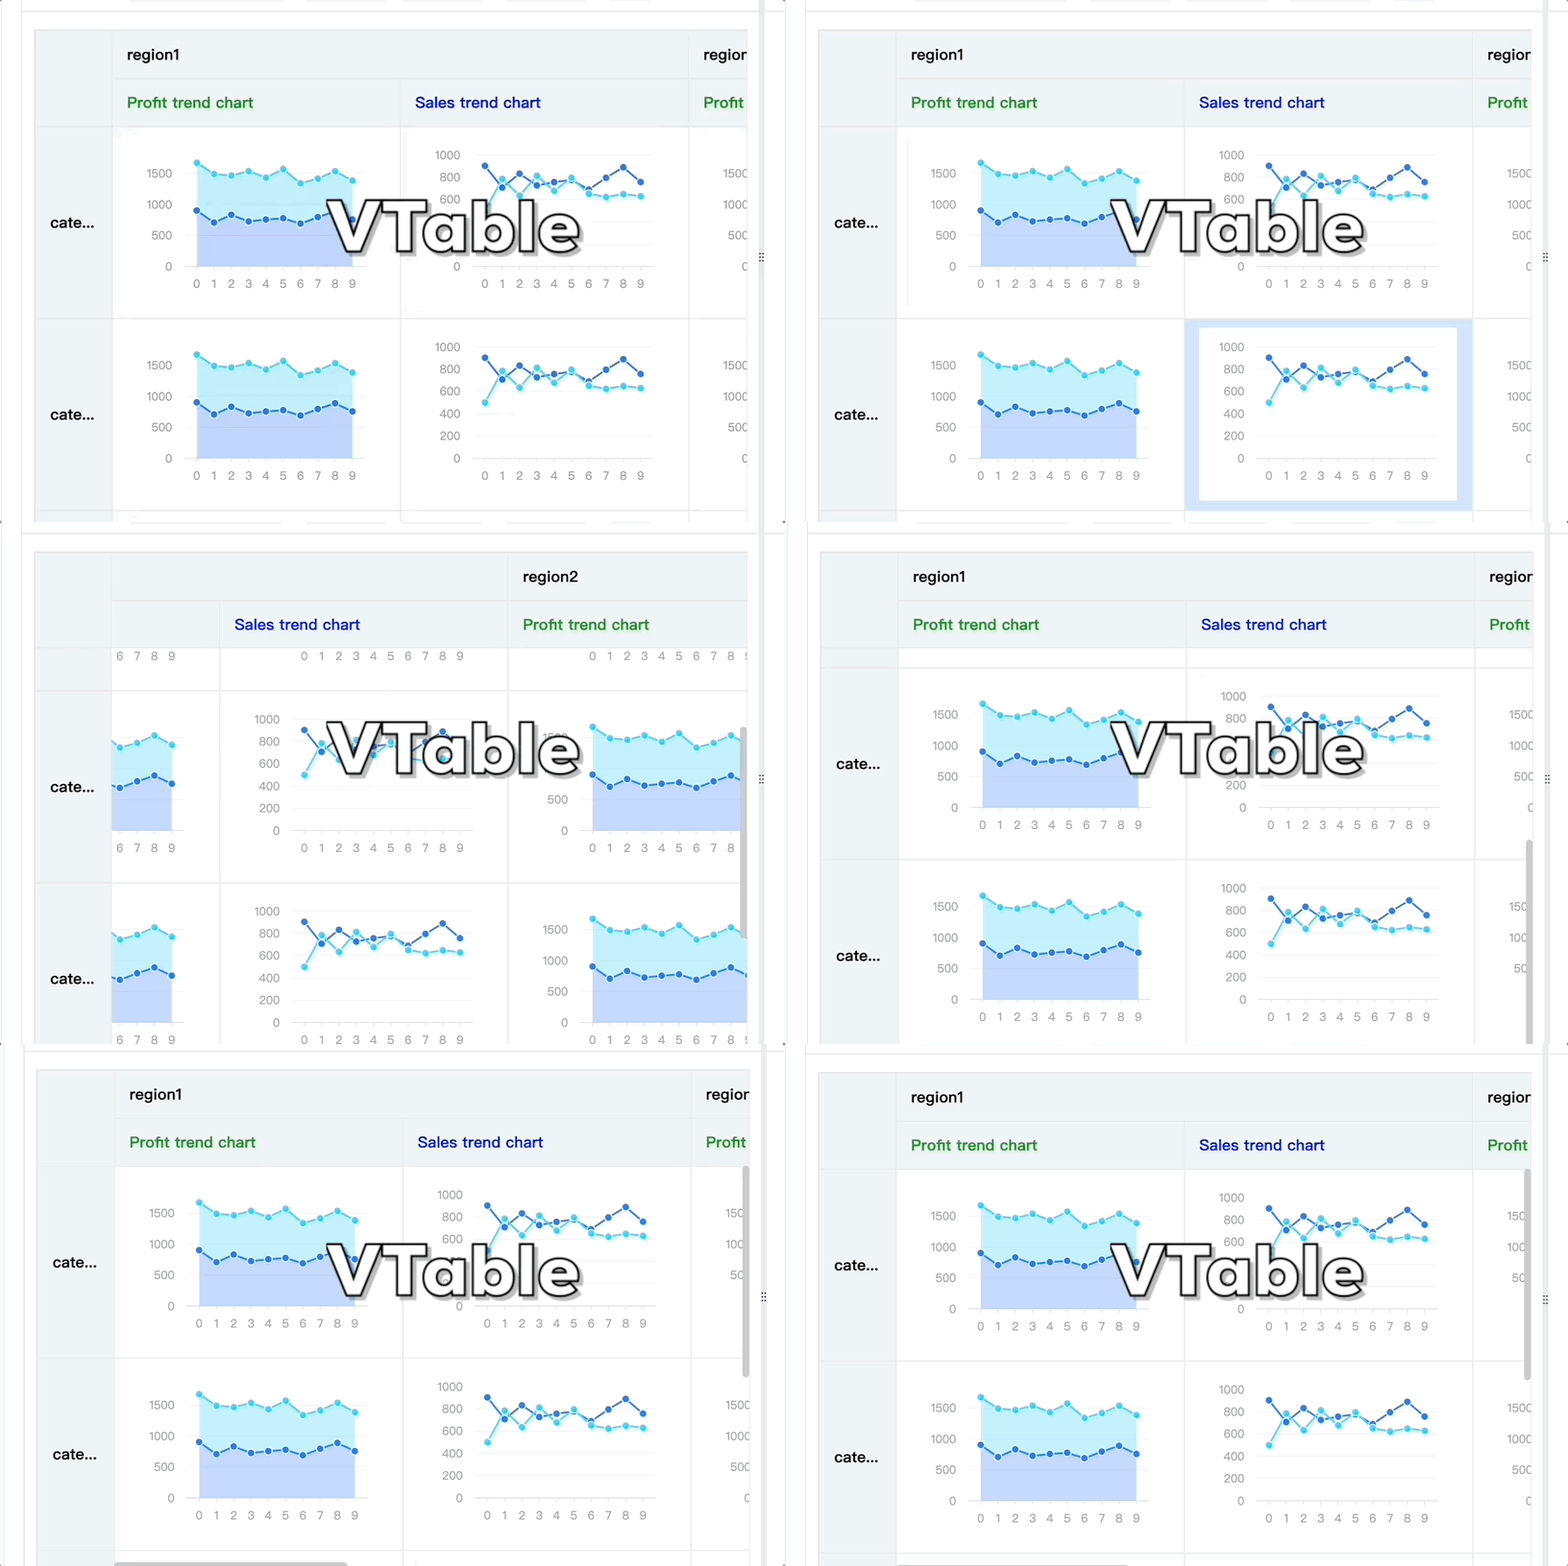
怎么提高页面中大量图表渲染的性能?特别是在滚动交互过程中。
问题描述
我的使用场景是需要批量绘制大量图表,不过这些图表具有一定的规律性,整行或者整列是同类型图表,有什么方式可以优化性能呢?现在问题是当滚动的时候,图表渲染跟不上,滚动交互也不流畅。
解决方案
在VTable中,使用 VChart 来绘制单元格内图表,内部做了渲染优化,可以解决这个问题。使用方式是如下:
代码示例
import * as VTable from '@visactor/vtable';
import VChart from '@visactor/vchart';

VTable.register.chartModule('vchart', VChart);
const records = [];
for (let i = 1; i <= 10; i++) {
  for (let j = 1; j <= 10; j++) {
    const record = {
      region: 'region' + i
    };
    record['category'] = 'category' + j;
    record.areaChart = [
      { x: '0', type: 'A', y: 900 + i + j },
      { x: '1', type: 'A', y: '707' },
      { x: '2', type: 'A', y: '832' },
      { x: '3', type: 'A', y: '726' },
      { x: '4', type: 'A', y: '756' },
      { x: '5', type: 'A', y: '777' },
      { x: '6', type: 'A', y: '689' },
      { x: '7', type: 'A', y: '795' },
      { x: '8', type: 'A', y: '889' },
      { x: '9', type: 'A', y: '757' },
      { x: '0', type: 'B', y: '773' },
      { x: '1', type: 'B', y: '785' },
      { x: '2', type: 'B', y: '635' },
      { x: '3', type: 'B', y: '813' },
      { x: '4', type: 'B', y: '678' },
      { x: '5', type: 'B', y: '796' },
      { x: '6', type: 'B', y: '652' },
      { x: '7', type: 'B', y: '623' },
      { x: '8', type: 'B', y: '649' },
      { x: '9', type: 'B', y: '630' }
    ];

    record.lineChart = [
      { x: '0', type: 'A', y: 900 + i + j },
      { x: '1', type: 'A', y: '707' },
      { x: '2', type: 'A', y: '832' },
      { x: '3', type: 'A', y: '726' },
      { x: '4', type: 'A', y: '756' },
      { x: '5', type: 'A', y: '777' },
      { x: '6', type: 'A', y: '689' },
      { x: '7', type: 'A', y: '795' },
      { x: '8', type: 'A', y: '889' },
      { x: '9', type: 'A', y: '757' },
      { x: '0', type: 'B', y: 500 },
      { x: '1', type: 'B', y: '785' },
      { x: '2', type: 'B', y: '635' },
      { x: '3', type: 'B', y: '813' },
      { x: '4', type: 'B', y: '678' },
      { x: '5', type: 'B', y: '796' },
      { x: '6', type: 'B', y: '652' },
      { x: '7', type: 'B', y: '623' },
      { x: '8', type: 'B', y: '649' },
      { x: '9', type: 'B', y: '630' }
    ];
    records.push(record);
  }
}

const option = {
  records,
  defaultRowHeight: 200,
  defaultHeaderRowHeight: 50,
  indicators: [
    {
      indicatorKey: 'lineChart',
      title: 'Sales trend chart',
      headerStyle: {
        color: 'blue'
        // bgColor: 'yellow',
      },
      cellType: 'chart',
      chartModule: 'vchart',
      width: 300,
      chartSpec: {
        type: 'common',
        series: [
          {
            type: 'line',
            data: {
              id: 'data'
            },
            xField: 'x',
            yField: 'y',
            seriesField: 'type'
          }
        ],
        axes: [
          { orient: 'left', range: { min: 0 } },
          { orient: 'bottom', label: { visible: true }, type: 'band' }
        ]
      }
    },
    {
      indicatorKey: 'areaChart',
      title: 'Profit trend chart',
      headerStyle: {
        color: 'green'
      },
      cellType: 'chart',
      chartModule: 'vchart',
      width: 300,
      chartSpec: {
        type: 'common',
        series: [
          {
            type: 'area',
            data: {
              id: 'data'
            },
            xField: 'x',
            yField: 'y',
            seriesField: 'type',
            point: {
              style: {
                fillOpacity: 1,
                strokeWidth: 0
              },
              state: {
                hover: {
                  fillOpacity: 0.5,
                  stroke: 'blue',
                  strokeWidth: 2
                },
                selected: {
                  fill: 'red'
                }
              }
            },
            area: {
              style: {
                fillOpacity: 0.3,
                stroke: '#000',
                strokeWidth: 4
              },
              state: {
                hover: {
                  fillOpacity: 1
                },
                selected: {
                  fill: 'red',
                  fillOpacity: 1
                }
              }
            }
          }
        ],
        axes: [
          { orient: 'left', range: { min: 0 } },
          { orient: 'bottom', label: { visible: true }, type: 'band' }
        ]
      }
    }
  ],
  columnTree: [
    {
      dimensionKey: 'region',
      value: 'region1',
      children: [
        {
          indicatorKey: 'areaChart'
        },
        {
          indicatorKey: 'lineChart'
        }
      ]
    },
    {
      dimensionKey: 'region',
      value: 'region2',
      children: [
        {
          indicatorKey: 'areaChart'
        },
        {
          indicatorKey: 'lineChart'
        }
      ]
    },
    {
      dimensionKey: 'region',
      value: 'region3',
      children: [
        {
          indicatorKey: 'areaChart'
        },
        {
          indicatorKey: 'lineChart'
        }
      ]
    }
  ],
  rowTree: [
    {
      dimensionKey: 'category',
      value: 'category1'
    },
    {
      dimensionKey: 'category',
      value: 'category2'
    },
    {
      dimensionKey: 'category',
      value: 'category3'
    },
    {
      dimensionKey: 'category',
      value: 'category4'
    },
    {
      dimensionKey: 'category',
      value: 'category1'
    },
    {
      dimensionKey: 'category',
      value: 'category2'
    },
    {
      dimensionKey: 'category',
      value: 'category3'
    },
    {
      dimensionKey: 'category',
      value: 'category4'
    },
    {
      dimensionKey: 'category',
      value: 'category1'
    },
    {
      dimensionKey: 'category',
      value: 'category2'
    },
    {
      dimensionKey: 'category',
      value: 'category3'
    },
    {
      dimensionKey: 'category',
      value: 'category4'
    },
    {
      dimensionKey: 'category',
      value: 'category1'
    },
    {
      dimensionKey: 'category',
      value: 'category2'
    },
    {
      dimensionKey: 'category',
      value: 'category3'
    },
    {
      dimensionKey: 'category',
      value: 'category4'
    }
  ],
  corner: {
    titleOnDimension: 'row'
  },
  dragOrder: {
    dragHeaderMode: 'all'
  }
};
const tableInstance = new VTable.PivotTable(document.getElementById(CONTAINER_ID), option);
结果展示