如何在表格组件中实现色阶效果?
问题描述
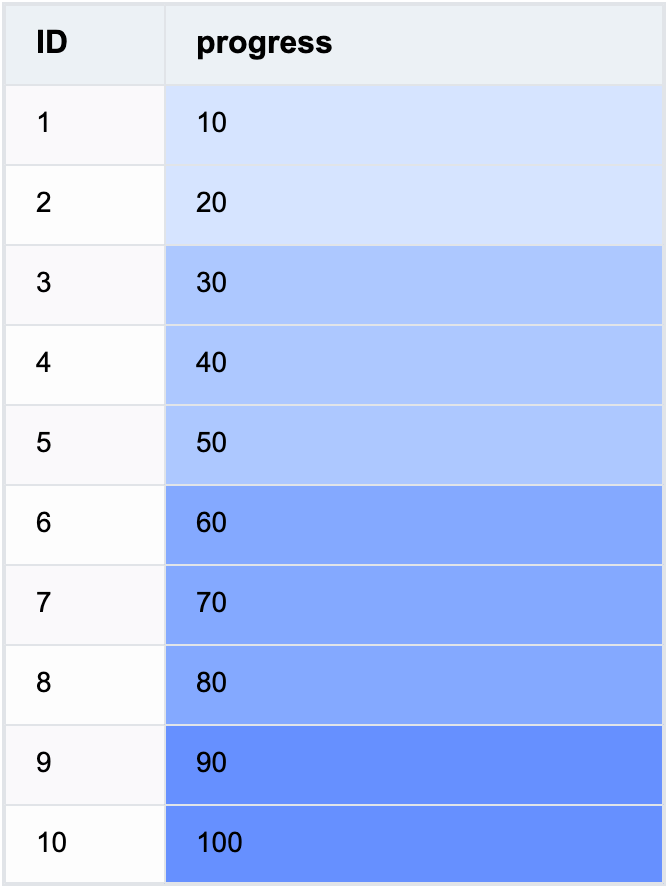
表格中单元格背景按照数据不同显示为不同颜色,实现一个色阶功能。如何在VTable中实现这个效果?
解决方案
可以通过在 columns 中将 style 中的 bgColor 设置为函数,按照不同数据,返回不同的颜色值,来实现色阶效果:
const BG_COLOR = (args: TYPES.StylePropertyFunctionArg): string => {
  const num = args.value;
  if (Number(num) > 80) {
    return '#6690FF';
  }
  if (Number(num) > 50) {
    return '#84A9FF';
  }
  if (Number(num) > 20) {
    return '#ADC8FF';
  }
  return '#D6E4FF';
};

const columns = [
  {
    style: {
      bgColor: BG_COLOR
    }
  }
];
代码示例
const BG_COLOR = (args: TYPES.StylePropertyFunctionArg): string => {
  const num = args.value;
  if (Number(num) > 80) {
    return '#6690FF';
  }
  if (Number(num) > 50) {
    return '#84A9FF';
  }
  if (Number(num) > 20) {
    return '#ADC8FF';
  }
  return '#D6E4FF';
};

const columns = [
  {
    field: 'id',
    title: 'ID',
    width: 80
  },
  {
    field: 'value',
    title: 'progress',
    style: {
      bgColor: BG_COLOR
    },
    width: 250
  }
];
const option: TYPES.ListTableConstructorOptions = {
  records,
  columns
};
new ListTable(document.getElementById('container'), option);
结果展示