有什么表格组件可以在单元格中支持显示迷你图吗?
问题描述
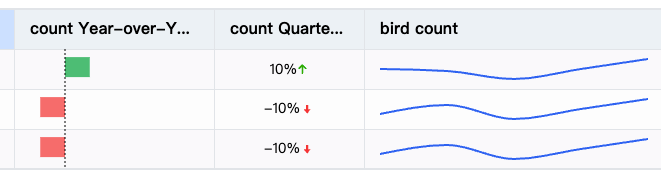
希望可以在销售统计表格中有单独一列来显示迷你折线图以体现显示的增长趋势。类似股票的日 K 线列表
解决方案
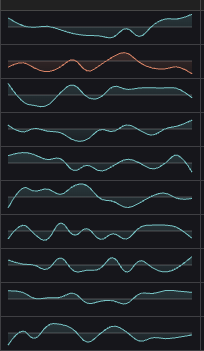
VTable 组件中配置 columnType: "sparkline",将单元格类型显示成迷你图。设置迷你图的具体样式可以设置 sparklineSpec 来实现。优势是:图和表融为一体没有割裂感,性能上体验感最佳。
代码示例
const columns: VTable.ColumnsDefine = [
    {
    field: "trend",
    title: "bird count",
    columnType: "sparkline",
    width: 300,
    sparklineSpec: {
      type: "line",
      xField: "x",
      yField: "y",
      pointShowRule: "none",
      smooth: true,
      line: {
        style: {
          stroke: "#2E62F1",
          strokeWidth: 2
        }
      },
      point: {
        hover: {
          stroke: "blue",
          strokeWidth: 1,
          fill: "red",
          shape: "circle",
          size: 4
        },
        style: {
          stroke: "red",
          strokeWidth: 1,
          fill: "yellow",
          shape: "circle",
          size: 2
        }
      },
      crosshair: {
        style: {
          stroke: "gray",
          strokeWidth: 1
        }
      }
    }
  }
  ...
];
结果展示