


如何在 notebook 中使用 @visactor/vchart 显示图表?
问题描述
希望能在 notebook 中使用 VChart
解决方案
不同图表库的解决方案不一样,根据你给的 demo,VChart 提供了基于 Python 的方案,安装即可
pip3 install py-vchart==1.0.0
代码示例
from pyvchart import render_chart
# spec's definition referenced in the JSON of https://www.visactor.io/vchart/guide/getting-started
spec = {
  "type": 'bar',
  "data": [
    {
      "id": 'barData',
      "values": [
        { "month": 'Monday', "sales": 22 },
        { "month": 'Tuesday', "sales": 13 },
        { "month": 'Wednesday', "sales": 25 },
        { "month": 'Thursday', "sales": 29 },
        { "month": 'Friday', "sales": 38 }
      ]
    }
  ],
  "xField": 'month',
  "yField": 'sales',
  "crosshair": {
    "xField": { "visible": True }
  }
};

render_chart(spec)
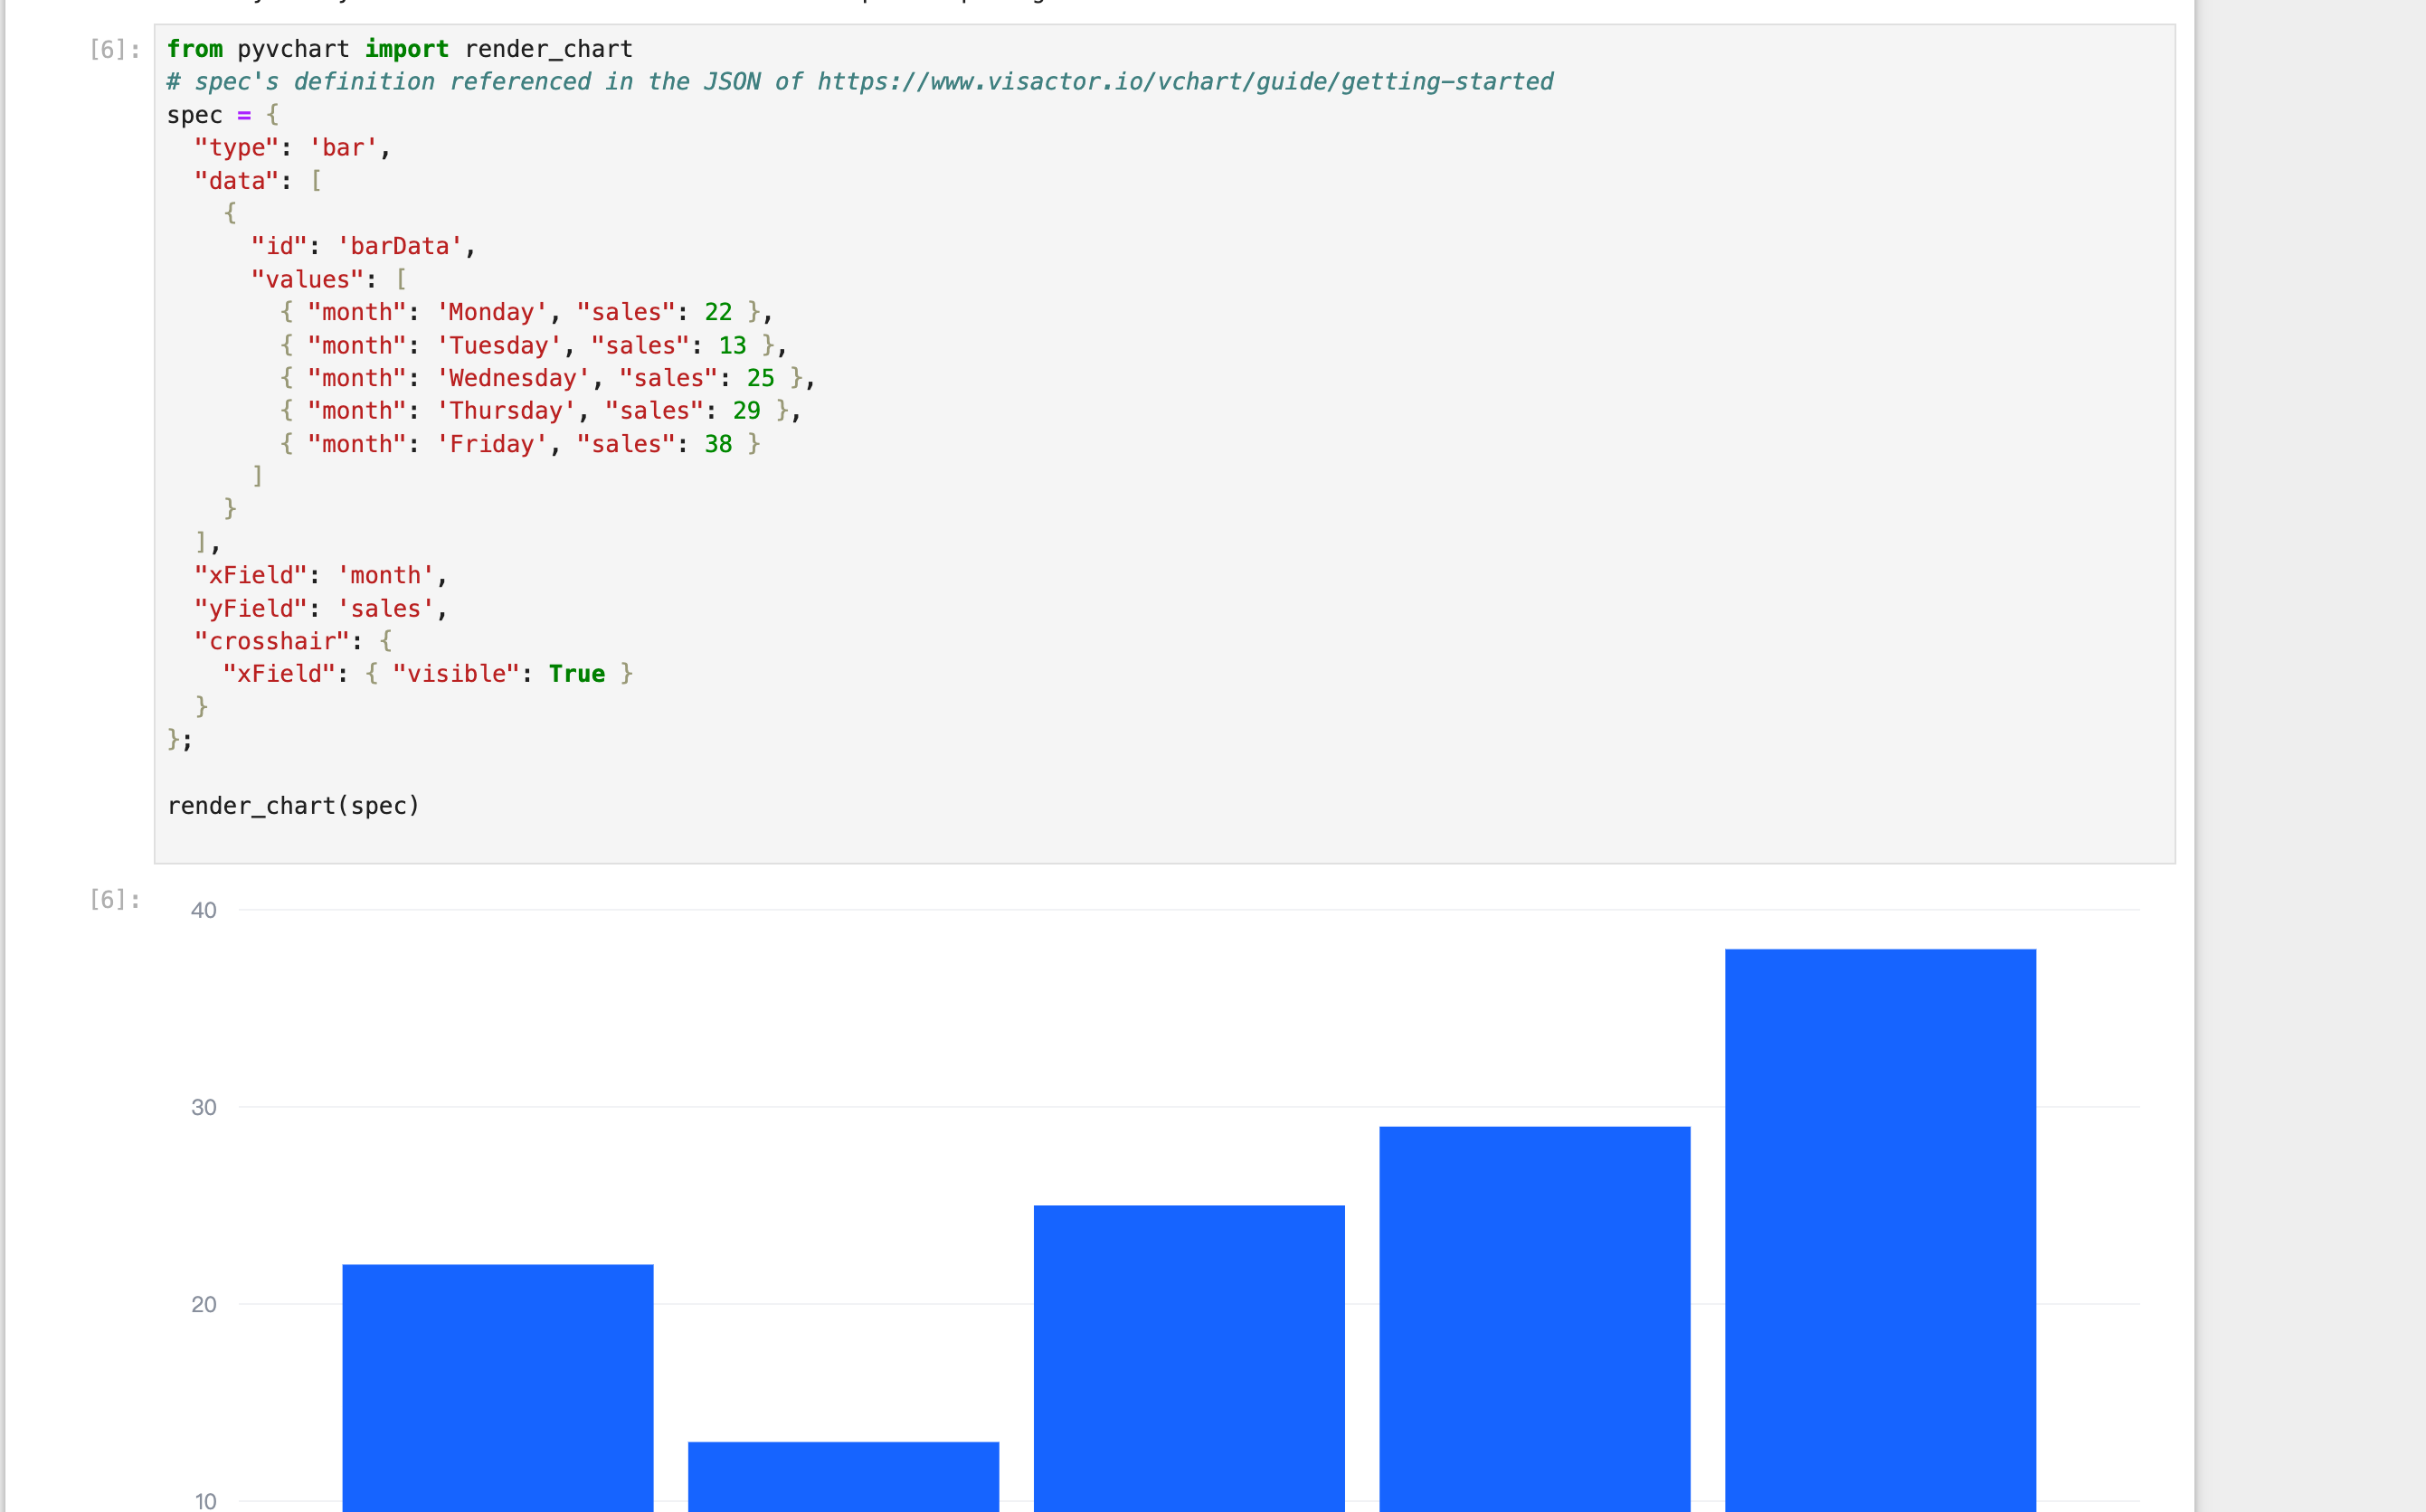
结果展示
相关文档
Python 教程:https://www.visactor.io/vchart/guide/tutorial_docs/Cross-terminal_and_Developer_Ecology/python github:https://github.com/VisActor/VChart